The Makran Subduction Zone, located in the northeastern Arabian Sea, is an active tectonic region where the Arabian Plate is subducting beneath the Eurasian Plate. This research employs advanced 3-D thermal modeling to analyze the thermal state of the subducting slab and its interaction with overlying materials. By examining slab metamorphism and fluid release patterns, we aim to uncover the links between thermal variations, metamorphic reactions, and seismicity. The results offer new perspectives on the behavior of subduction zones, particularly in regions where significant seismic events occur due to slab dehydration and other related processes. This work contributes to the broader understanding of subduction dynamics and provides valuable data for seismic hazard assessment in the Makran region.
10.26464/epp2025004
Subduction thermal state, slab metamorphism, and seismicity in the Makran Subduction Zone
4-Mar-2025
Additional Media
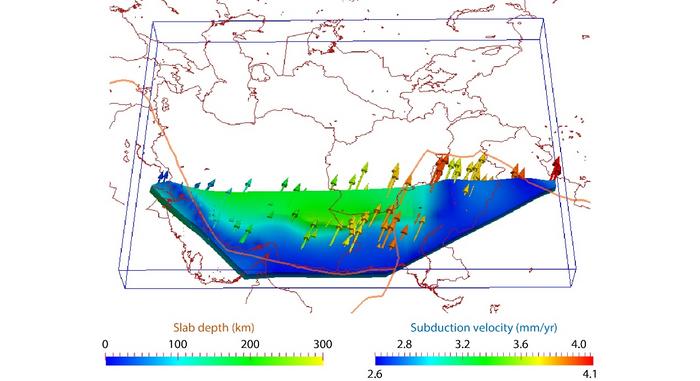
Visualization of thermal state and slab depth in the Makran Subduction ZoneFig 2 Slab geometry and subduction velocities of the Arabian Plate. The color of the slab indicates the depth. The colored arrows indicate the slab velocity and induced mantle flows Credit: Beijing Zhongke Journal Publising Co. Ltd.
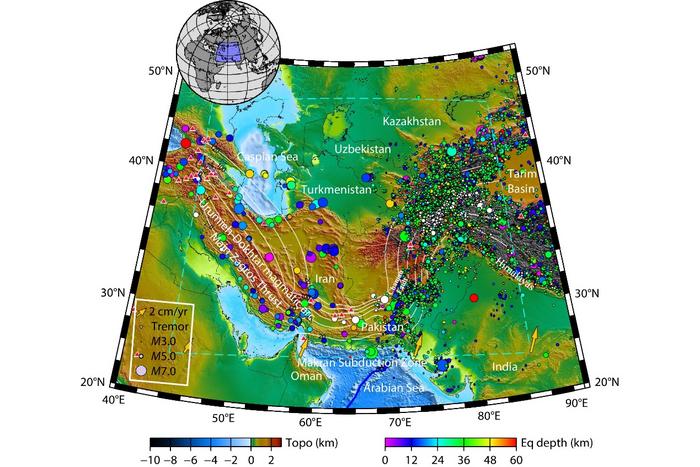
Visualization of thermal state and slab depth in the Makran Subduction ZoneFig 1 tectonic map of the Makran Subduction Zone. Background colors indicate the surface topography (ETOPO;Smith and Sandwell, 1997). The white curved lines indicate the isodepth contours of the upper surfaces of the Arabian and Indian Plates at intervals of 20 km (interpolation from Slab2;Hayes et al., 2018). The dashed light blue lines represent the model region for the subducting Arabian Plate. The colored circles show Credit: Beijing Zhongke Journal Publising Co. Ltd.
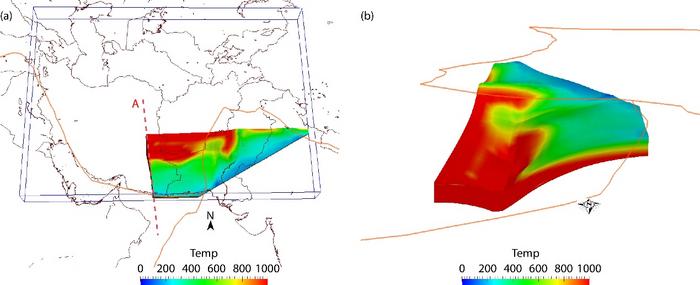
Visualization of thermal state and slab depth in the Makran Subduction ZoneFig 4 The cross-sectional temperature distribution along profile A in eastern Iran. (a) The location of Profile A and the thermal structure (°C) at the rest plate interface calculated in this study; (b) side view (from west) of the thermal structure (°C) along cross-section A and the rest plate interface. Credit: Beijing Zhongke Journal Publising Co. Ltd.